
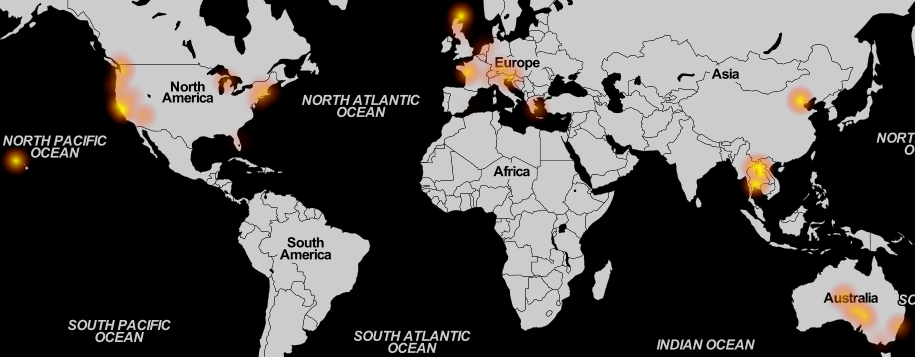
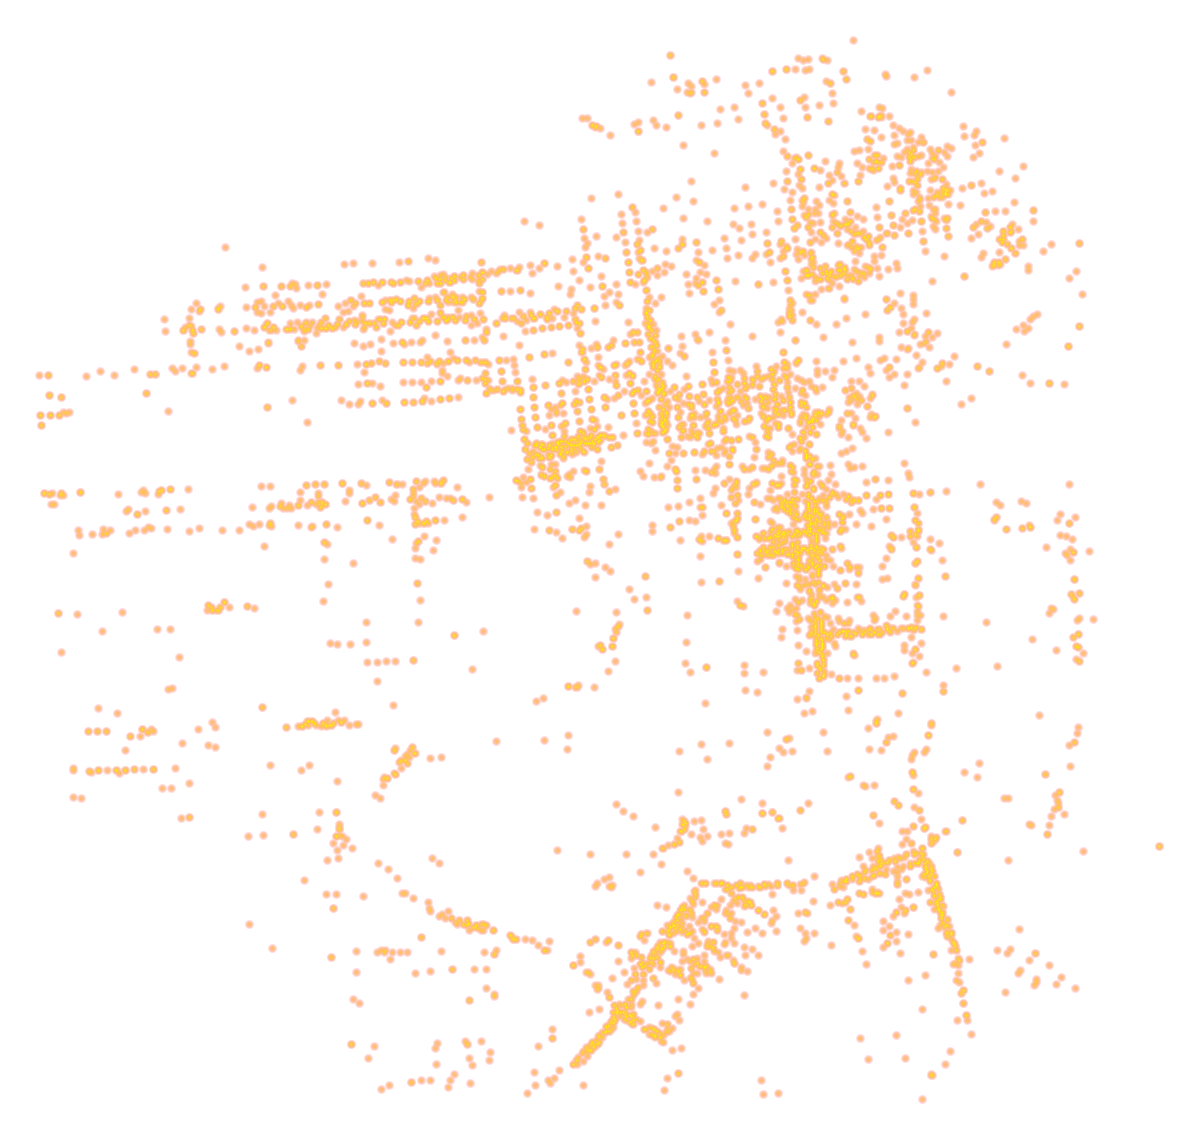
heatmap.py -o photos.png --width 1000 --osm -B 0.8 --osm_base https://tiles.openfreemap.org/styles/positron photo-points
(I've been geocoding my photos since 2004.)
Map tiles by Stamen Design, under CC BY 3.0 (now available from OpenFreeMap). Data by OpenStreetMap, under CC BY SA.
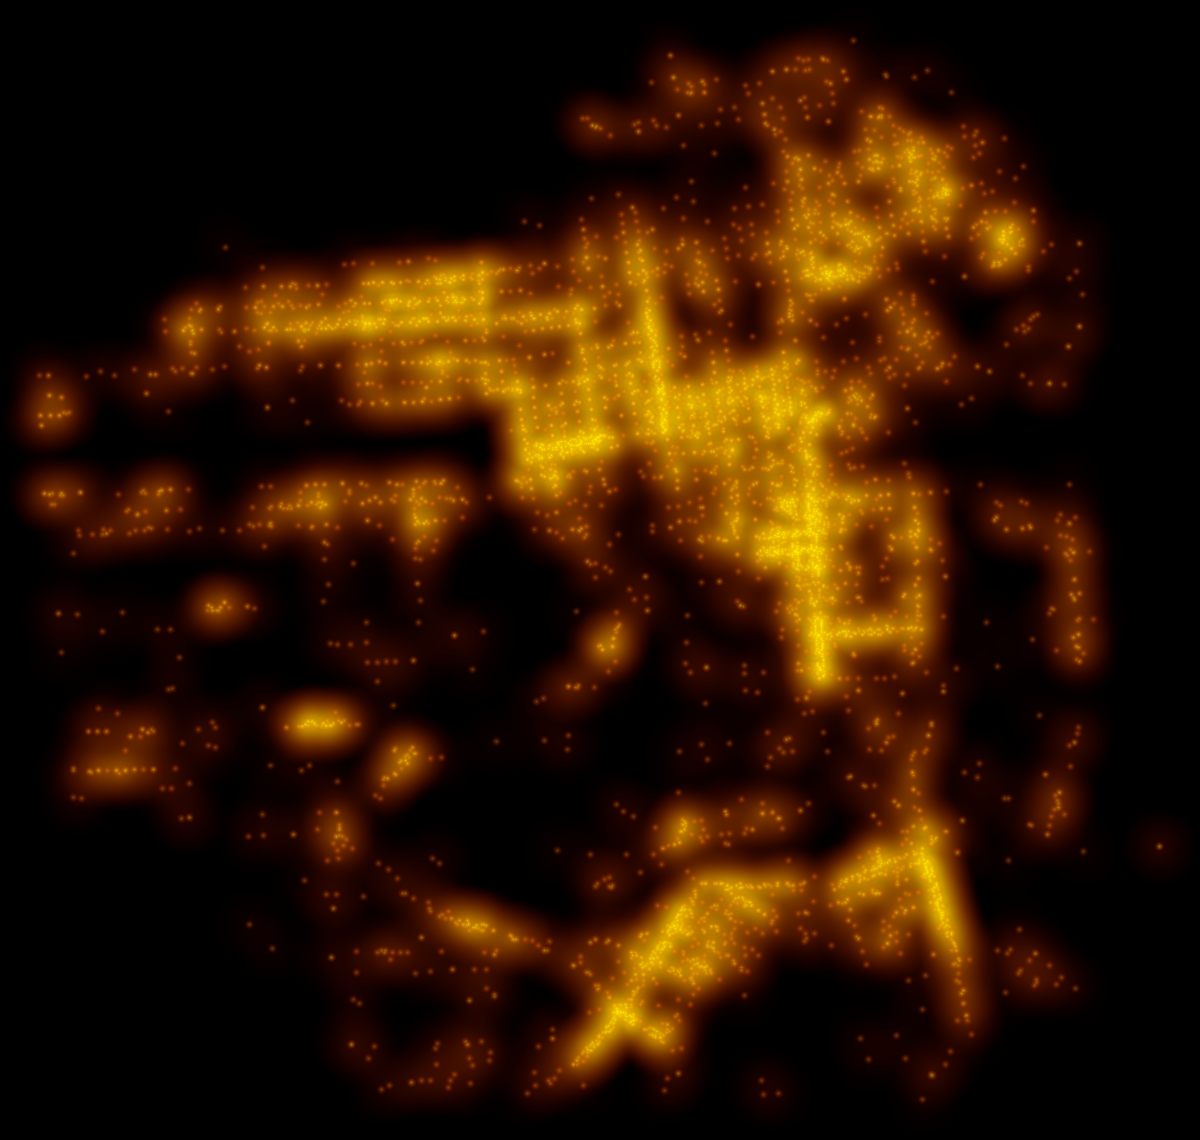
Graffiti complaints in San Francisco over 90 days.
There's a trade-off between seeing the precise location of each data point, and seeing the aggregate regional blobs that make trends easier to see. Here I did both and composited one on top of the other using ImageMagick.
heatmap.py -b black -r 30 -W 1200 -o g1.png -P equirectangular graffiti.coords;Data from datasf.org. I don't know what system the coordinates are in, so I just pretended they're square and mapped them as-is.
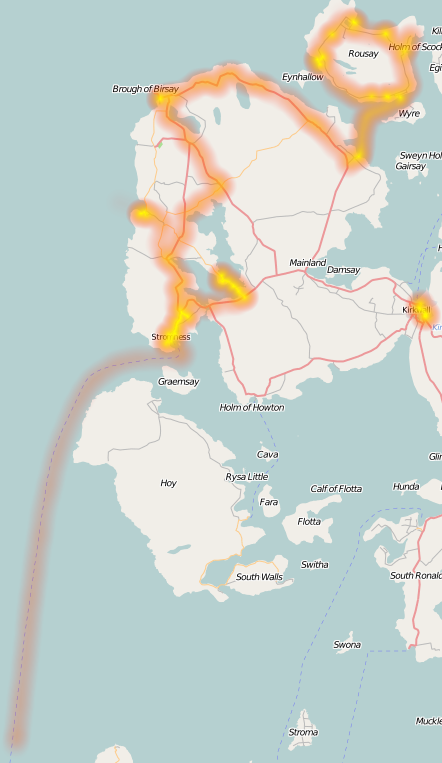
heatmap.py -o orkney.png --height 800 --osm orkney.gpx
Background © OpenStreetMap & contributors; this image is available under CC-BY-SA
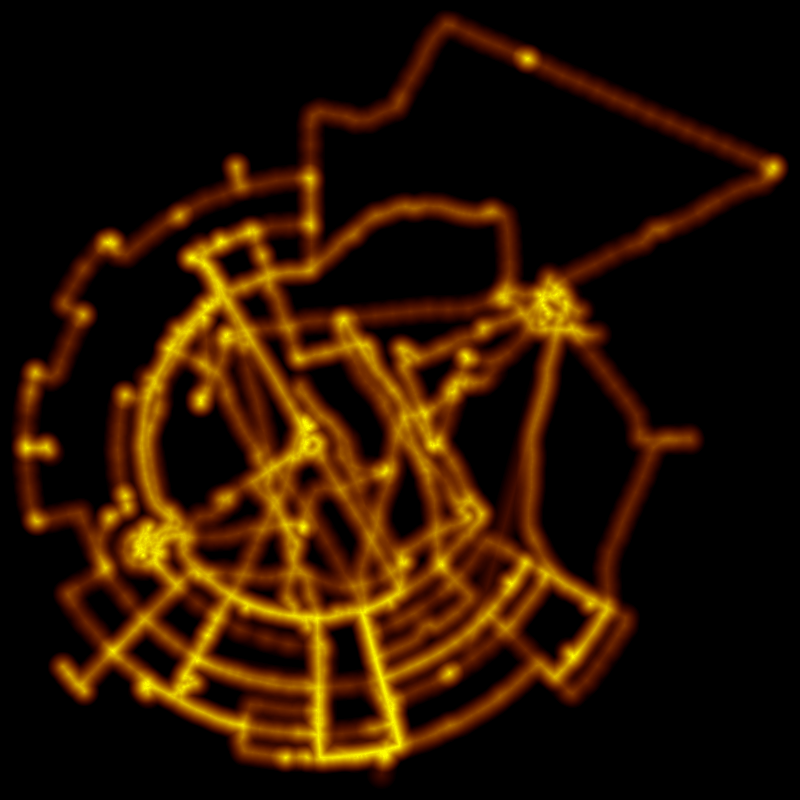
heatmap.py --decay 0.8 -o bman.png --height 800 --margin 10 -b black --gradient gradient-1.2.png bman.gpx
(I carried a GPS around all week.)
There are a few kinds of heat maps. This program is for when you have data points with 2-d coordinates (perhaps latitude and longitude), and you want to plot them such that they blob together and get bright where they pile up, showing off the data density.
If you've divided your map into regions and want each region colored a certain way (a choropleth map), or you have a formula that gives you a value for every pixel on the map, this is not the right tool.
It's just one file: heatmap.py. I've put it on github in case anyone wants to contribute. If you want the --osm option to work, you'll also need osmviz and should read the bit about OSM licensing issues.
Now get yourself some data (or grab my list of photo coordinates) and just try it out. See the examples on this page, read the command line help for a very brief rundown on the options, and maybe eventually read the rest of this page. In general, the program will tell you if needs more information.
I wanted to make some data maps and I couldn't find any free tools that did a good job. I found proprietary tools that produced gorgeous output, and free tools that I felt took the wrong approach. Had I discovered gheat sooner, I probably would have started with that, but this is a bit different, better for some things, worse for others.
It's a Python script, which makes it most suitable for server-side image generation or preparing images in the comfort of your own home.
How long it takes is roughly proportional to
num_points * radius2,
so if you want to try things out quickly, start with a small radius,
and/or less data.
The memory footprint depends on the settings. With --decay set
between 0 and 1, the memory use will be dominated by
num_points * radius2. With decay
set to exactly 0 or 1, the rendering only needs to hold data
proportional to the size of the output image, which is usually
negligible. At that point, the major factor will be whether it needs
to read in all the data at once.
Currently it needs to know the extent (bounding box) of the data at the
outset, so if you don't specify one using --extent, all the data will
be read first, then held in memory for the rest of the processing.
In that case memory use will be proportional to the size of your data set.
If you use --decay of 0 or 1 and use --extent and give either the height
or width (or --osm and --zoom), then the memory footprint won't depend
on the input significantly and you should be able to push any amount of
data through. (I tried 10 million points, worked great.)
It's to make it prettier and to make it convey your information better. If you set it to 1, it works like most people's heatmaps do, adding points on top of each other linearly. Depending on your data distribution, this may mean areas with relatively low density are hard to see. The highest concentrations stand out, but the dimmer areas are nearly invisible.
If you set it to 0, every data point will be visible, turning the plot into "how far is it to the nearest point" and conveying nothing at all about density. It will look more like a scatter plot (or a line drawing, if you have GPS tracks).
All the other heatmap software I've looked at works at one of these extremes (usually the former), but I find it looks better and conveys more information somewhere in between. I was unable to find a magic value that works well for everything, so you may want to fiddle with this. There's no right answer. You just have to decide what makes sense for your application and your data.
The catch is that when the decay is 1 or 0, the heatmap can be computed using much less memory. if it's anything in between (as it is by default), the memory footprint is considerably greater.
You can specify the color gradient on the command line by providing hue, saturation, value, and alpha for the two extremes. The program will use linear interpolation in HSV space to render the in-between values. Note that hue is specified with three digits in case you want to go around the other way on the color wheel. For example, 000ffff00 and 100ffff00 specify the same color, but pass through different hues on the way to 02affffff.
The other option is to supply an image. The pixels down the left edge are used to specify the gradient. (For example.)
If you use the --osm option to overlay your data onto OpenStreetMap tiles, you are bound by their terms of service.
Here's what you get when you use --help.
usage: heatmap.py [-h] [--filetype {plain,gpx,csv,shp,auto}]
                  [--ignore_csv_header] [-s SCALE] [-W WIDTH] [-H HEIGHT]
                  [-P NAME] [-e RANGE] [-R MARGIN] [-r RADIUS] [-d DECAY]
                  [-S FILE] [-L FILE] [-o FILE] [-a] [--frequency FREQUENCY]
                  [--straggler_threshold STRAGGLER_THRESHOLD] [-F STR] [-K]
                  [-b COLOR] [-I FILE] [-B BACKGROUND_BRIGHTNESS] [-N]
                  [-m HEX] [-M HEX] [-G FILE] [-k {linear,gaussian}] [--osm]
                  [--osm_base URL] [--osm_path_template TEMPLATE] [-z ZOOM]
                  [-v] [--debug] [--version]
                  [FILE ...]

plot a heatmap from coordinate data

positional arguments:
  FILE                  input files (default: None)

options:
  -h, --help            show this help message and exit
  --filetype {plain,gpx,csv,shp,auto}
                        Treat all input files as this type. ("auto" will guess
                        based on the filename extension.); default: auto
  --ignore_csv_header   ignore first line of CSV input files (default: False)
  -s SCALE, --scale SCALE
                        meters per pixel, approximate (default: None)
  -W WIDTH, --width WIDTH
                        width of output image (default: None)
  -H HEIGHT, --height HEIGHT
                        height of output image (default: None)
  -P NAME, --projection NAME
                        default: mercator
  -e RANGE, --extent RANGE
                        Clip results to RANGE, which is specified as
                        lat1,lon1,lat2,lon2; (for square mercator:
                        -85.0511,-180,85.0511,180) (default: None)
  -R MARGIN, --margin MARGIN
                        Try to keep data at least this many pixels away from
                        image border. (default: 0)
  -r RADIUS, --radius RADIUS
                        pixel radius of point blobs; default: 5
  -d DECAY, --decay DECAY
                        float in [0,1]; Larger values give more weight to data
                        magnitude. Smaller values are more democratic.
                        default:0.95
  -S FILE, --save FILE  save processed data to FILE (default: None)
  -L FILE, --load FILE  load processed data from FILE (default: None)
  -o FILE, --output FILE
                        name of output file (image or video) (default: None)
  -a, --animate         Make an animation instead of a static image (default:
                        False)
  --frequency FREQUENCY
                        input points per animation frame; default: 1
  --straggler_threshold STRAGGLER_THRESHOLD
                        add one more animation frame if >= this many inputs
                        remain (default: 1)
  -F STR, --ffmpegopts STR
                        extra options to pass to ffmpeg when making an
                        animation (default: None)
  -K, --keepframes      keep intermediate images after creating an animation
                        (default: False)
  -b COLOR, --background COLOR
                        composite onto this background (color name or #rrggbb)
                        (default: None)
  -I FILE, --background_image FILE
                        composite onto this image (default: None)
  -B BACKGROUND_BRIGHTNESS, --background_brightness BACKGROUND_BRIGHTNESS
                        Multiply each pixel in background image by this.
                        (default: None)
  -N, --invert_background
                        Value-invert the background image. (Cannot be used
                        with -B) (default: False)
  -m HEX, --hsva_min HEX
                        hhhssvvaa hex for minimum data values; default:
                        000ffff00
  -M HEX, --hsva_max HEX
                        hhhssvvaa hex for maximum data values; default:
                        02affffff
  -G FILE, --gradient FILE
                        Take color gradient from this the first column of
                        pixels in this image. Overrides -m and -M. (default:
                        None)
  -k {linear,gaussian}, --kernel {linear,gaussian}
                        Kernel to use for the falling-off function; default:
                        linear
  --osm                 Composite onto OpenStreetMap tiles (default: False)
  --osm_base URL        Base URL for map tiles; default
                        http://tile.openstreetmap.org
  --osm_path_template TEMPLATE
                        URL path template for map tiles; default
                        /{z}/{x}/{y}.png
  -z ZOOM, --zoom ZOOM  Zoom level for OSM; 0 means autozoom. (default: 0)
  -v, --verbose
  --debug
  --version             show program's version number and exit